Facebook Page Quality and Page Insights provide important information about your Page’s health and compliance with Facebook policies.
Monitoring these reports regularly helps you:
✔ Understand how Facebook views your Page
✔ Detect potential issues early
✔ Prevent message or posting restrictions
✔ Avoid temporary bans or blocks
Why Page Quality Matters
Facebook may limit certain Page actions — such as sending Messenger messages or posting content — when:
- Page receives spam reports
- Community Standard violations occur
- Users mark messages or comments as inappropriate
- Automated or spam-like behavior is detected
Such limits may result in:
- Messenger restrictions
- Messaging quota reduction
- Live posting limitations
- Temporary bans
Where to Find Page Quality and Insights
To view your Page quality and metrics:
- Go to your Facebook Page
- Click Page Settings
- Choose Page Quality
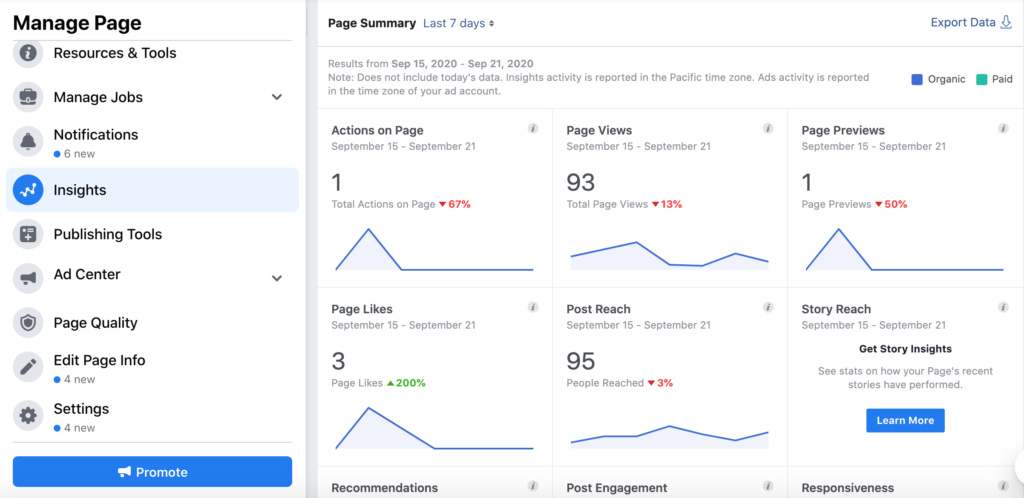
- Choose Insights
Here you can see:
✔ Content issues
✔ Spam reports
✔ Community standard flags
✔ Engagement trends
✔ Messaging insights
✔ Audience reactions
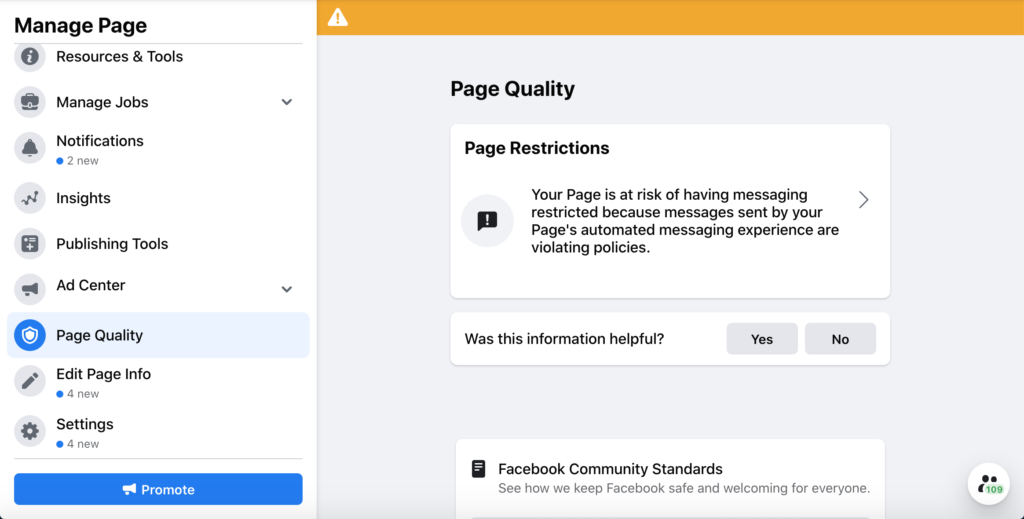
What to Look For ?
🟡 Content Violations
Check for:
- Community Standard violations
- Copyright issues
- Hate speech or policy flags
🟡 Messaging Reports
Check if:
- Users reported messages as spam
- Messenger interactions dropped suddenly
- Automated replies triggered warnings
🟡 Engagement vs Spam
If engagement is unusually high while Page quality drops, it might be due to:
✅ Organic interest
❌ Spam-like behavior
How Monitoring Helps Prevent Restrictions
When you monitor Page Quality and Insights:
✔ Catch policy warnings early
✔ Adjust messaging behavior proactively
✔ Reduce risk of temporary restrictions
✔ Improve overall Page rating
Best Practices to Protect Your Page
✔ Avoid spam-like automation
✔ Respond to messages within 24 hours
✔ Do not send repeated or unsolicited bulk messages
✔ Encourage organic interaction
✔ Fix content or policy issues immediately
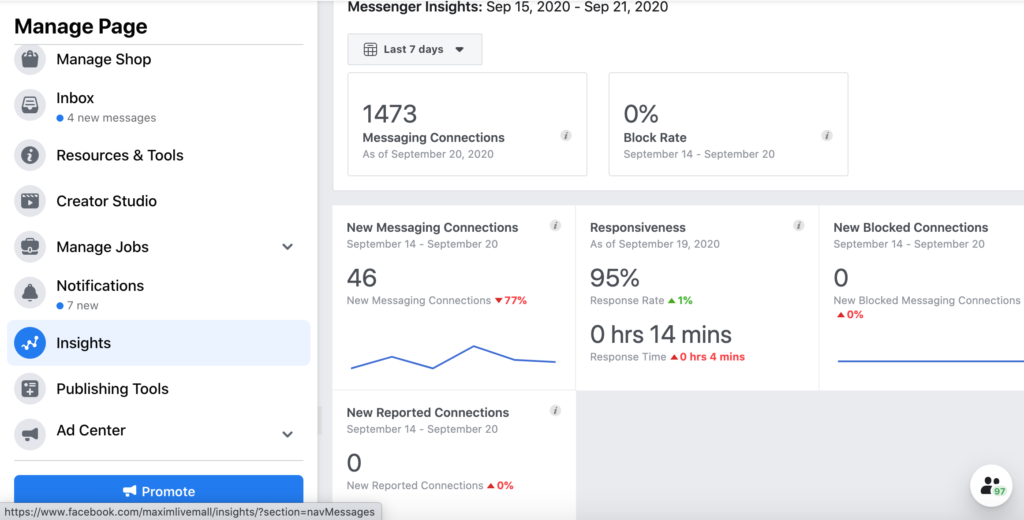
What’s an average block rate and what’s a high block rate on Facebook Messenger?
- 1-2% – Normal. A few people blocking you on Facebook Messenger, but nothing to get concerned about.
- 3-5% – Above average. If your number starts creeping up to 3% or more, it’s time to take a look at what you’re doing and why more people are blocking you.
- 6-8% – High. Something is clearly off, and you’re approaching the danger zone.
🔗 Related Resources
🔗 Facebook Messaging Restrictions Explained
🔗 Facebook Blocked from Sending Messages
🔗 Facebook Permission Expired
🔗 Troubleshooting Messaging Delivery Issues