
Analytics Dashboard
The Analytics Dashboard gives you a visual summary of your business performance — including order trends, daily sales, revenue received, and how customers are paying.
How to open the Analytics Dashboard
Section titled “How to open the Analytics Dashboard”- Click Analytics in the left menu.
- Set a Start Date and End Date using the date filters.
- Choose a tab: Summary, Sales by time, Sales item table, Sales by Post, Monthly, or Special.
Sales by Post and Monthly need a Business plan. Special (top spenders over 30 days) needs an Enterprise plan.
Summary view
Section titled “Summary view”Order status summary
Section titled “Order status summary”Shows how many orders are in each status right now — a quick health check on your order pipeline.
Number of payments
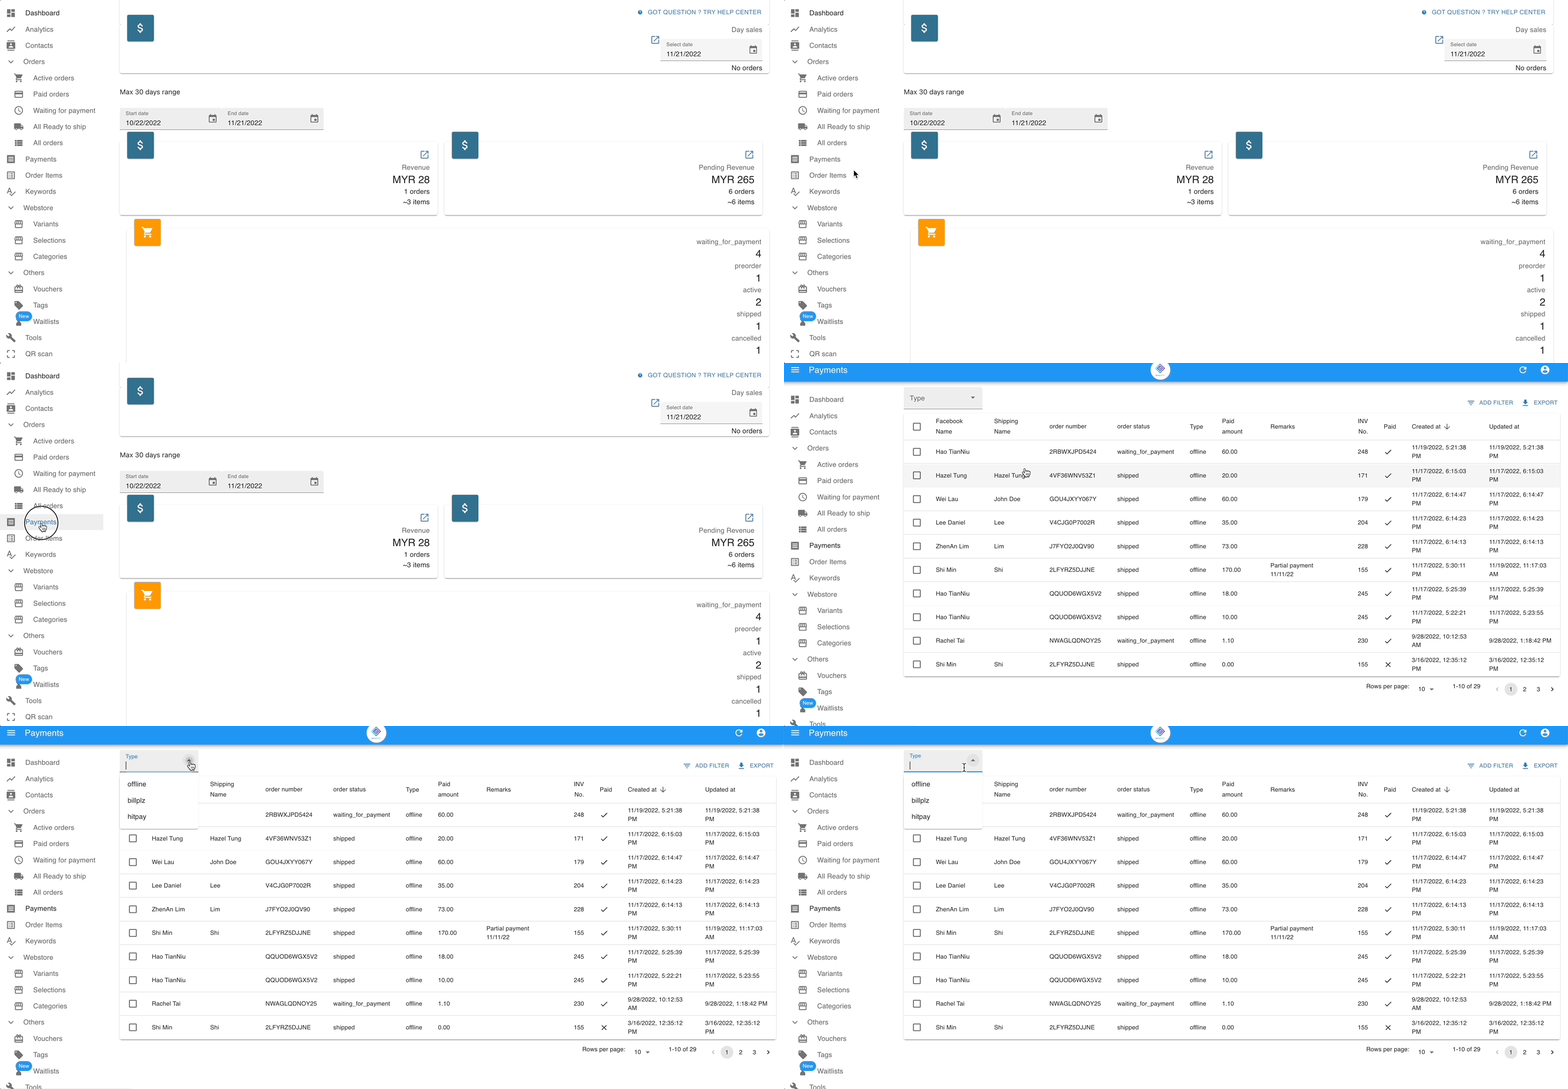
Section titled “Number of payments”Compares how many payments are online vs offline, and whether they have been reconciled (matched to your records).
- Green = unpaid or not yet reconciled
- Blue = paid and reconciled
To see full payment details, click Payments in the left menu.
See: Payment Reconciliation Guide
Sales by time
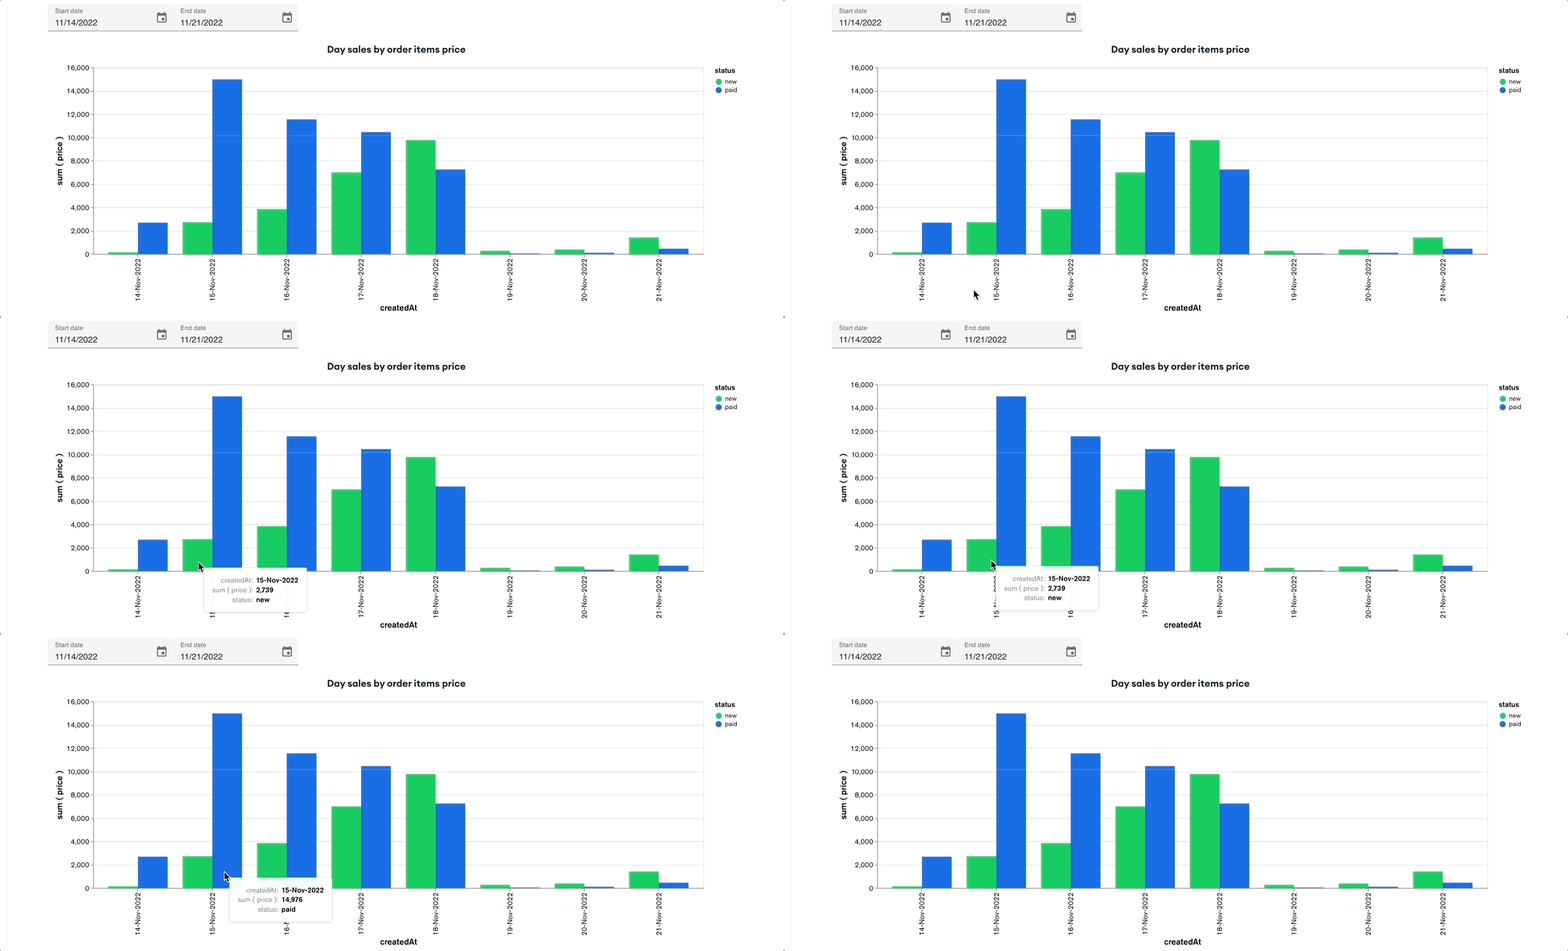
Section titled “Sales by time”Daily sales chart
Section titled “Daily sales chart”Shows total item sales per day for the selected date range.
Sales item table
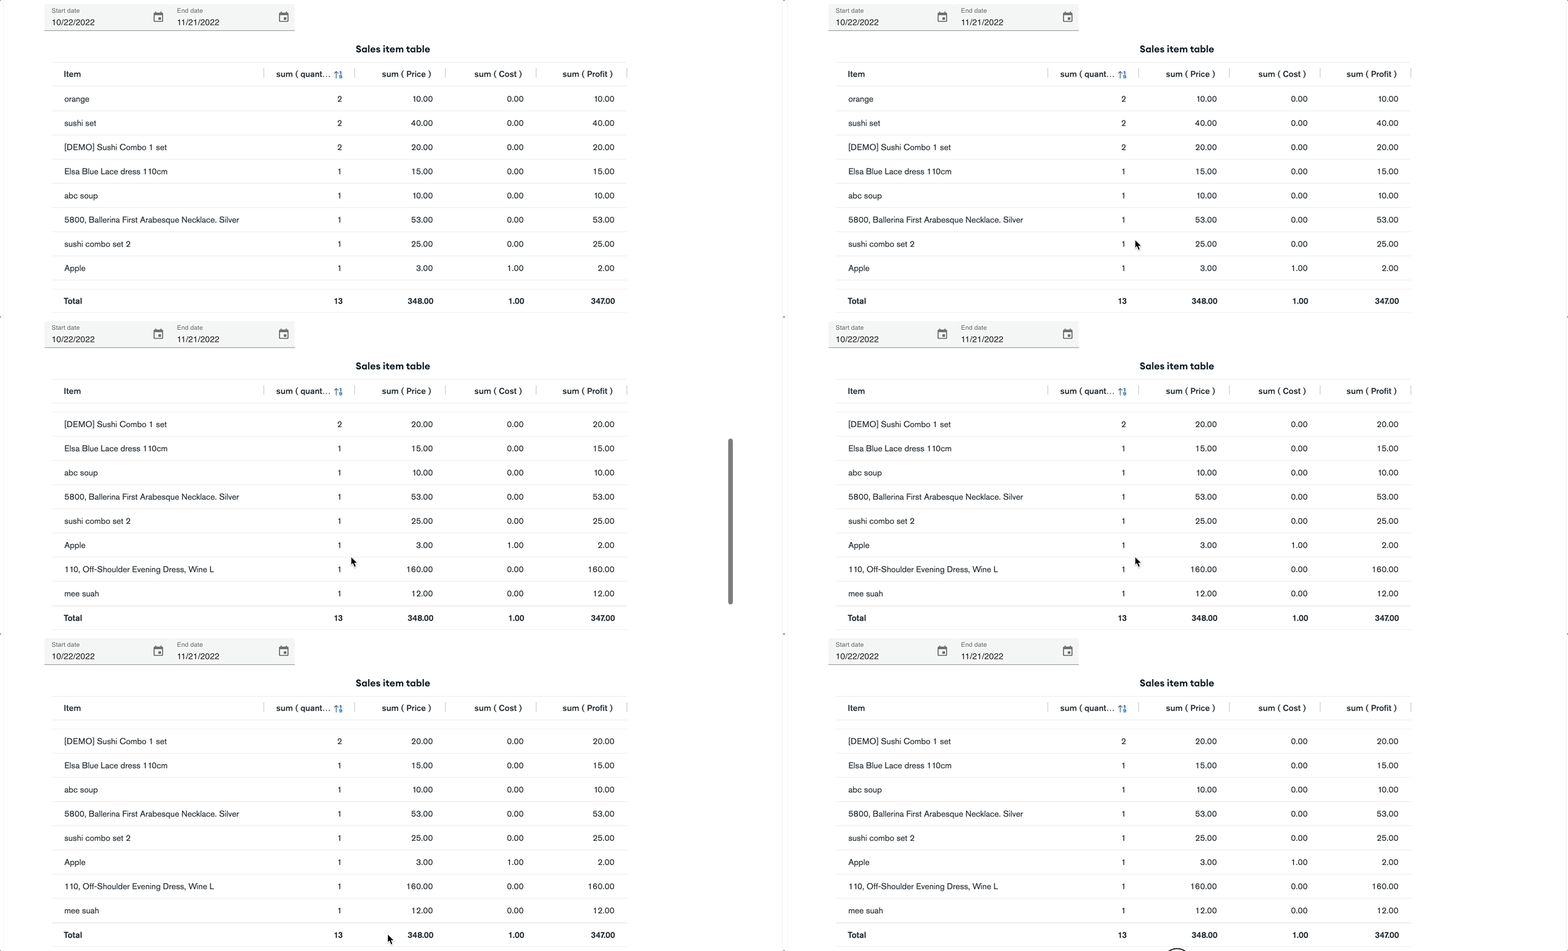
Section titled “Sales item table”Shows how many units of each item were sold, plus profit if you entered a cost at item setup.
Revenue charts
Section titled “Revenue charts”The revenue charts live inside the Sales by time tab.
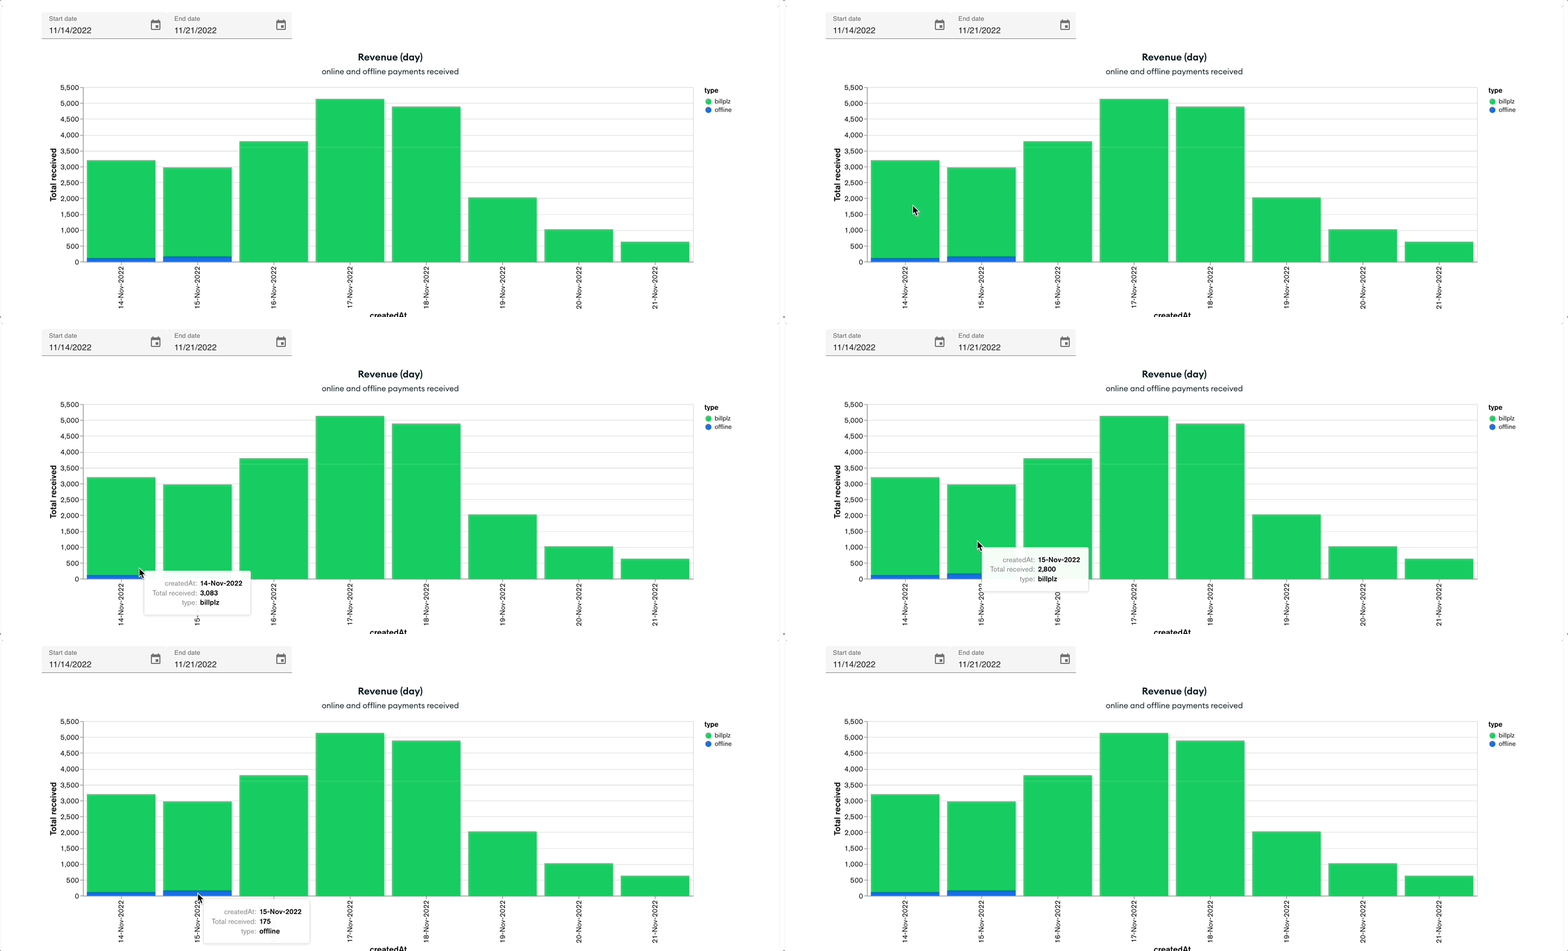
Revenue by day
Section titled “Revenue by day”Shows the sum of online and offline payments received per day, including shipping if the customer paid for it.
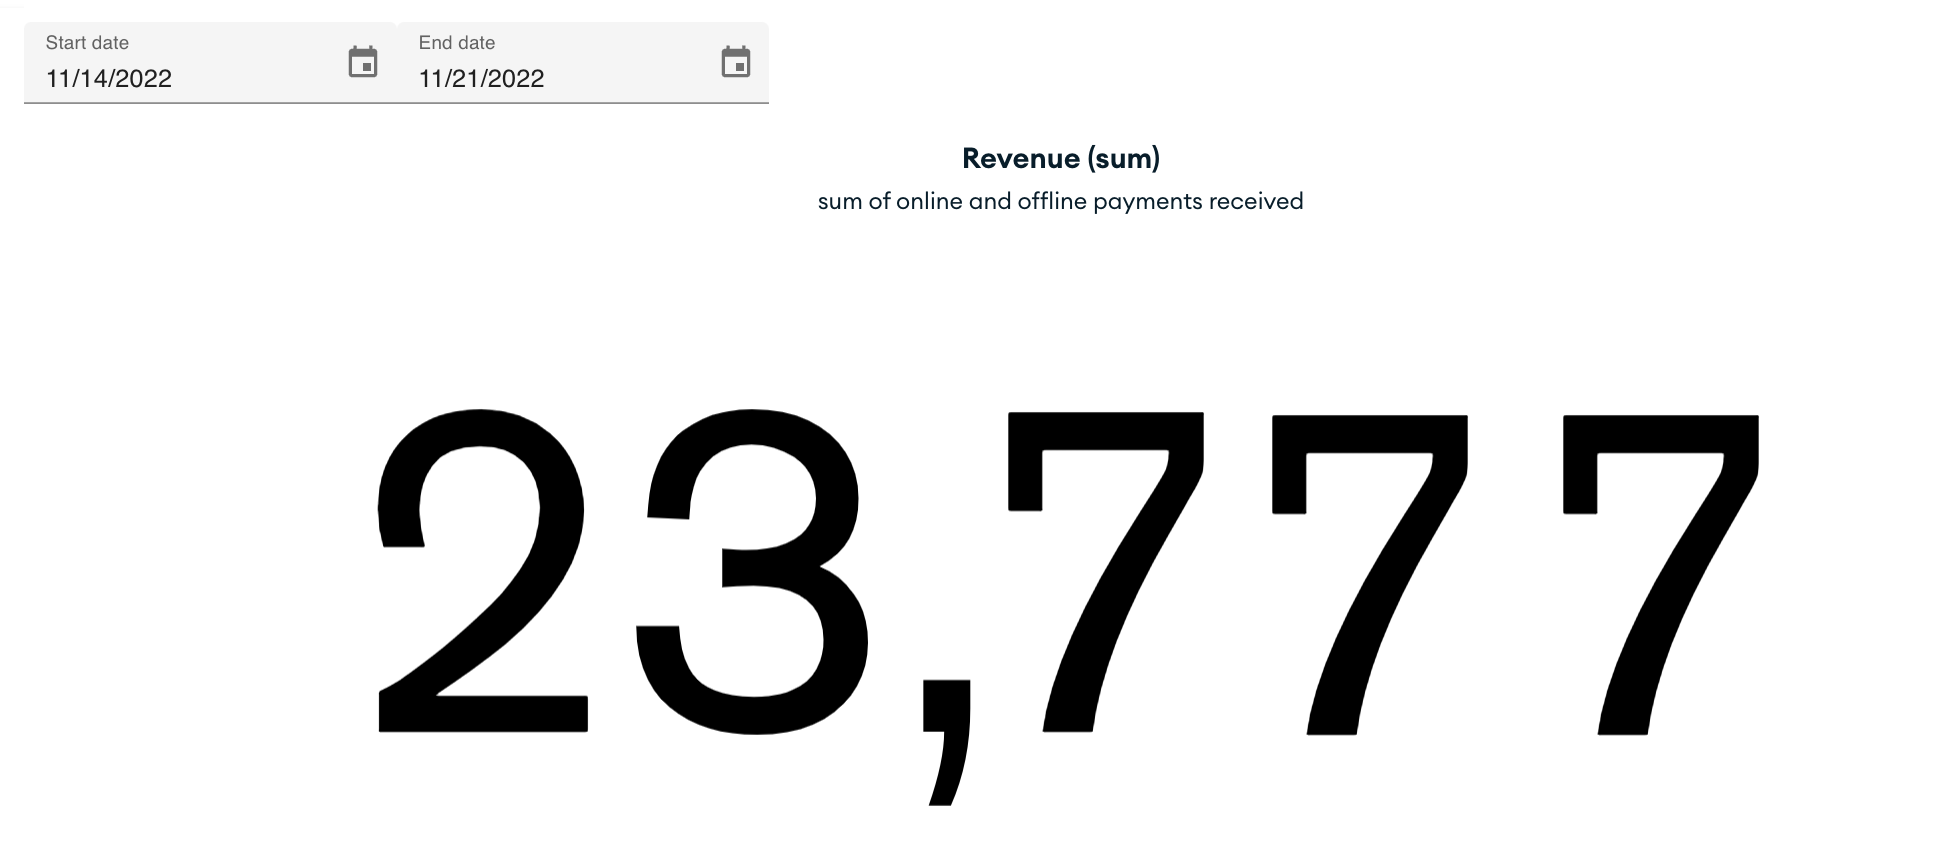
Revenue total
Section titled “Revenue total”Shows total revenue collected within the selected date range.
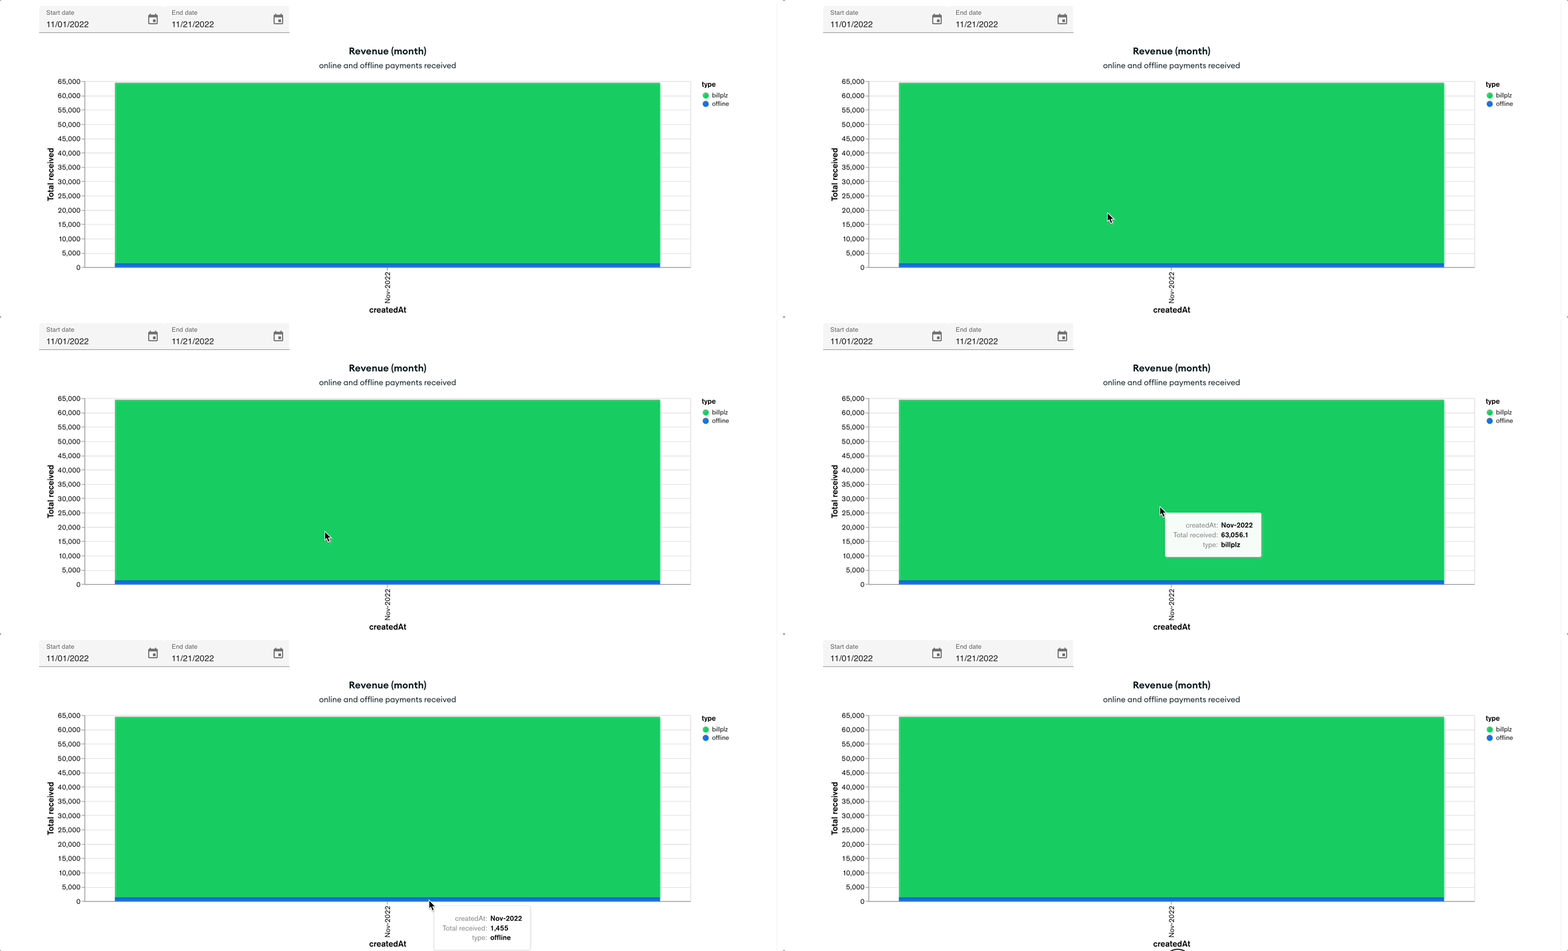
Monthly
Section titled “Monthly”Shows month-by-month revenue so you can spot longer-term trends or seasonal patterns.
Why revenue may look different from sales
Section titled “Why revenue may look different from sales”The Sales chart counts items by the date they were sold. The Revenue chart sums the payments you actually received. These two figures will often differ — that is normal. See About Revenue for more detail.
See also: